Health Dashboard Part 5: Did Yesterday's Food Affect Today's Run?
Overview
The Running tab built in Part 3 shows what happened during each run. The Nutrition × Exercise tab asks a different question: does what you ate yesterday predict how well you run today?
For morning runners the timing is obvious once you say it out loud. If you run at 8am, you haven’t eaten yet. The fuel for that effort is whatever you consumed the day before — carbs, calories, protein for recovery. Same-day nutrition is mostly post-workout. The correlation that actually matters is prior-day food against that morning’s performance.
This tab makes that comparison concrete.
The two-section structure
The tab has two sections stacked vertically: 15 days on top, 30 days below. Both follow the same layout.
The 15-day window is where patterns show up clearly. Thirty days smooths over too much — an off week gets averaged away. Fifteen days is tight enough to see whether a stretch of under-fueling corresponds with slower or higher-HR runs.
Each section starts with an overview: how many workout days, how many rest days, how many days where both Strava and MFP data exist (the “paired days” the analysis runs on). Below that, nutrition on workout days compared against rest days:
Workout days (N days): 1,850 kcal | protein 142g | carbs 198g | fat 62g
Rest days    (N days): 1,620 kcal | protein 118g | carbs 165g | fat 58g
Then the energy balance on workout days: average calories consumed, average calories burned (from Strava’s detailed endpoint), and the net. That net number is often more interesting than either source alone.
The day-by-day detail
Below the aggregate rows, each paired day gets its own entry — workout, nutrition, and prior-day nutrition listed together:
2026-05-26
  - Run: Easy 10K | 10.1 km | pace 6:08/km | avg HR 143 / max 157 bpm | +45m elev | 680 kcal
  - Same-day nutrition: 1,185 kcal | protein 98g | carbs 138g | fat 34g
  - Prior day (2026-05-25) nutrition: 1,920 kcal | protein 145g | carbs 210g | fat 65g
With a few weeks of data you start to notice things. Days where the prior-day carbs were under 130g tend to show higher HR at the same pace — not always, but often enough to be worth watching. Days with prior-day protein above 140g tend to come after runs that felt better than the HR suggested.
None of this is controlled enough to be science. It’s pattern recognition on a sample of one. But it’s your patterns, not a generic recommendation.
The tab only appears when you have data
If MFP data is unavailable or nothing is logged for the period, the tab doesn’t appear at all. The check happens at startup: the dashboard looks at whether any days in the 30-day window have actual nutrition entries. If none do, the tab is skipped.
This prevents an empty or misleading tab from rendering when auth is stale. You open the dashboard, and if the tab is there, there’s something worth looking at.
The AI coach evaluation
Each period ends with a coaching evaluation, same pattern as the Running tab. The prompt gives the coach the full day-by-day dataset — workout details, same-day nutrition, prior-day nutrition, aggregate averages — and asks for a specific analysis:
- How prior-day carbs, calories, and protein correlate with next-day pace and HR
- Whether calorie balance is sustainable on hard training days
- Whether protein supports recovery between sessions
- Nutrition patterns on workout days versus rest days
The evaluation is generated via claude -p at startup (or on demand if the cache is cold) and cached for 8 hours. The daily key means it’s fresh each morning without mid-session regeneration.
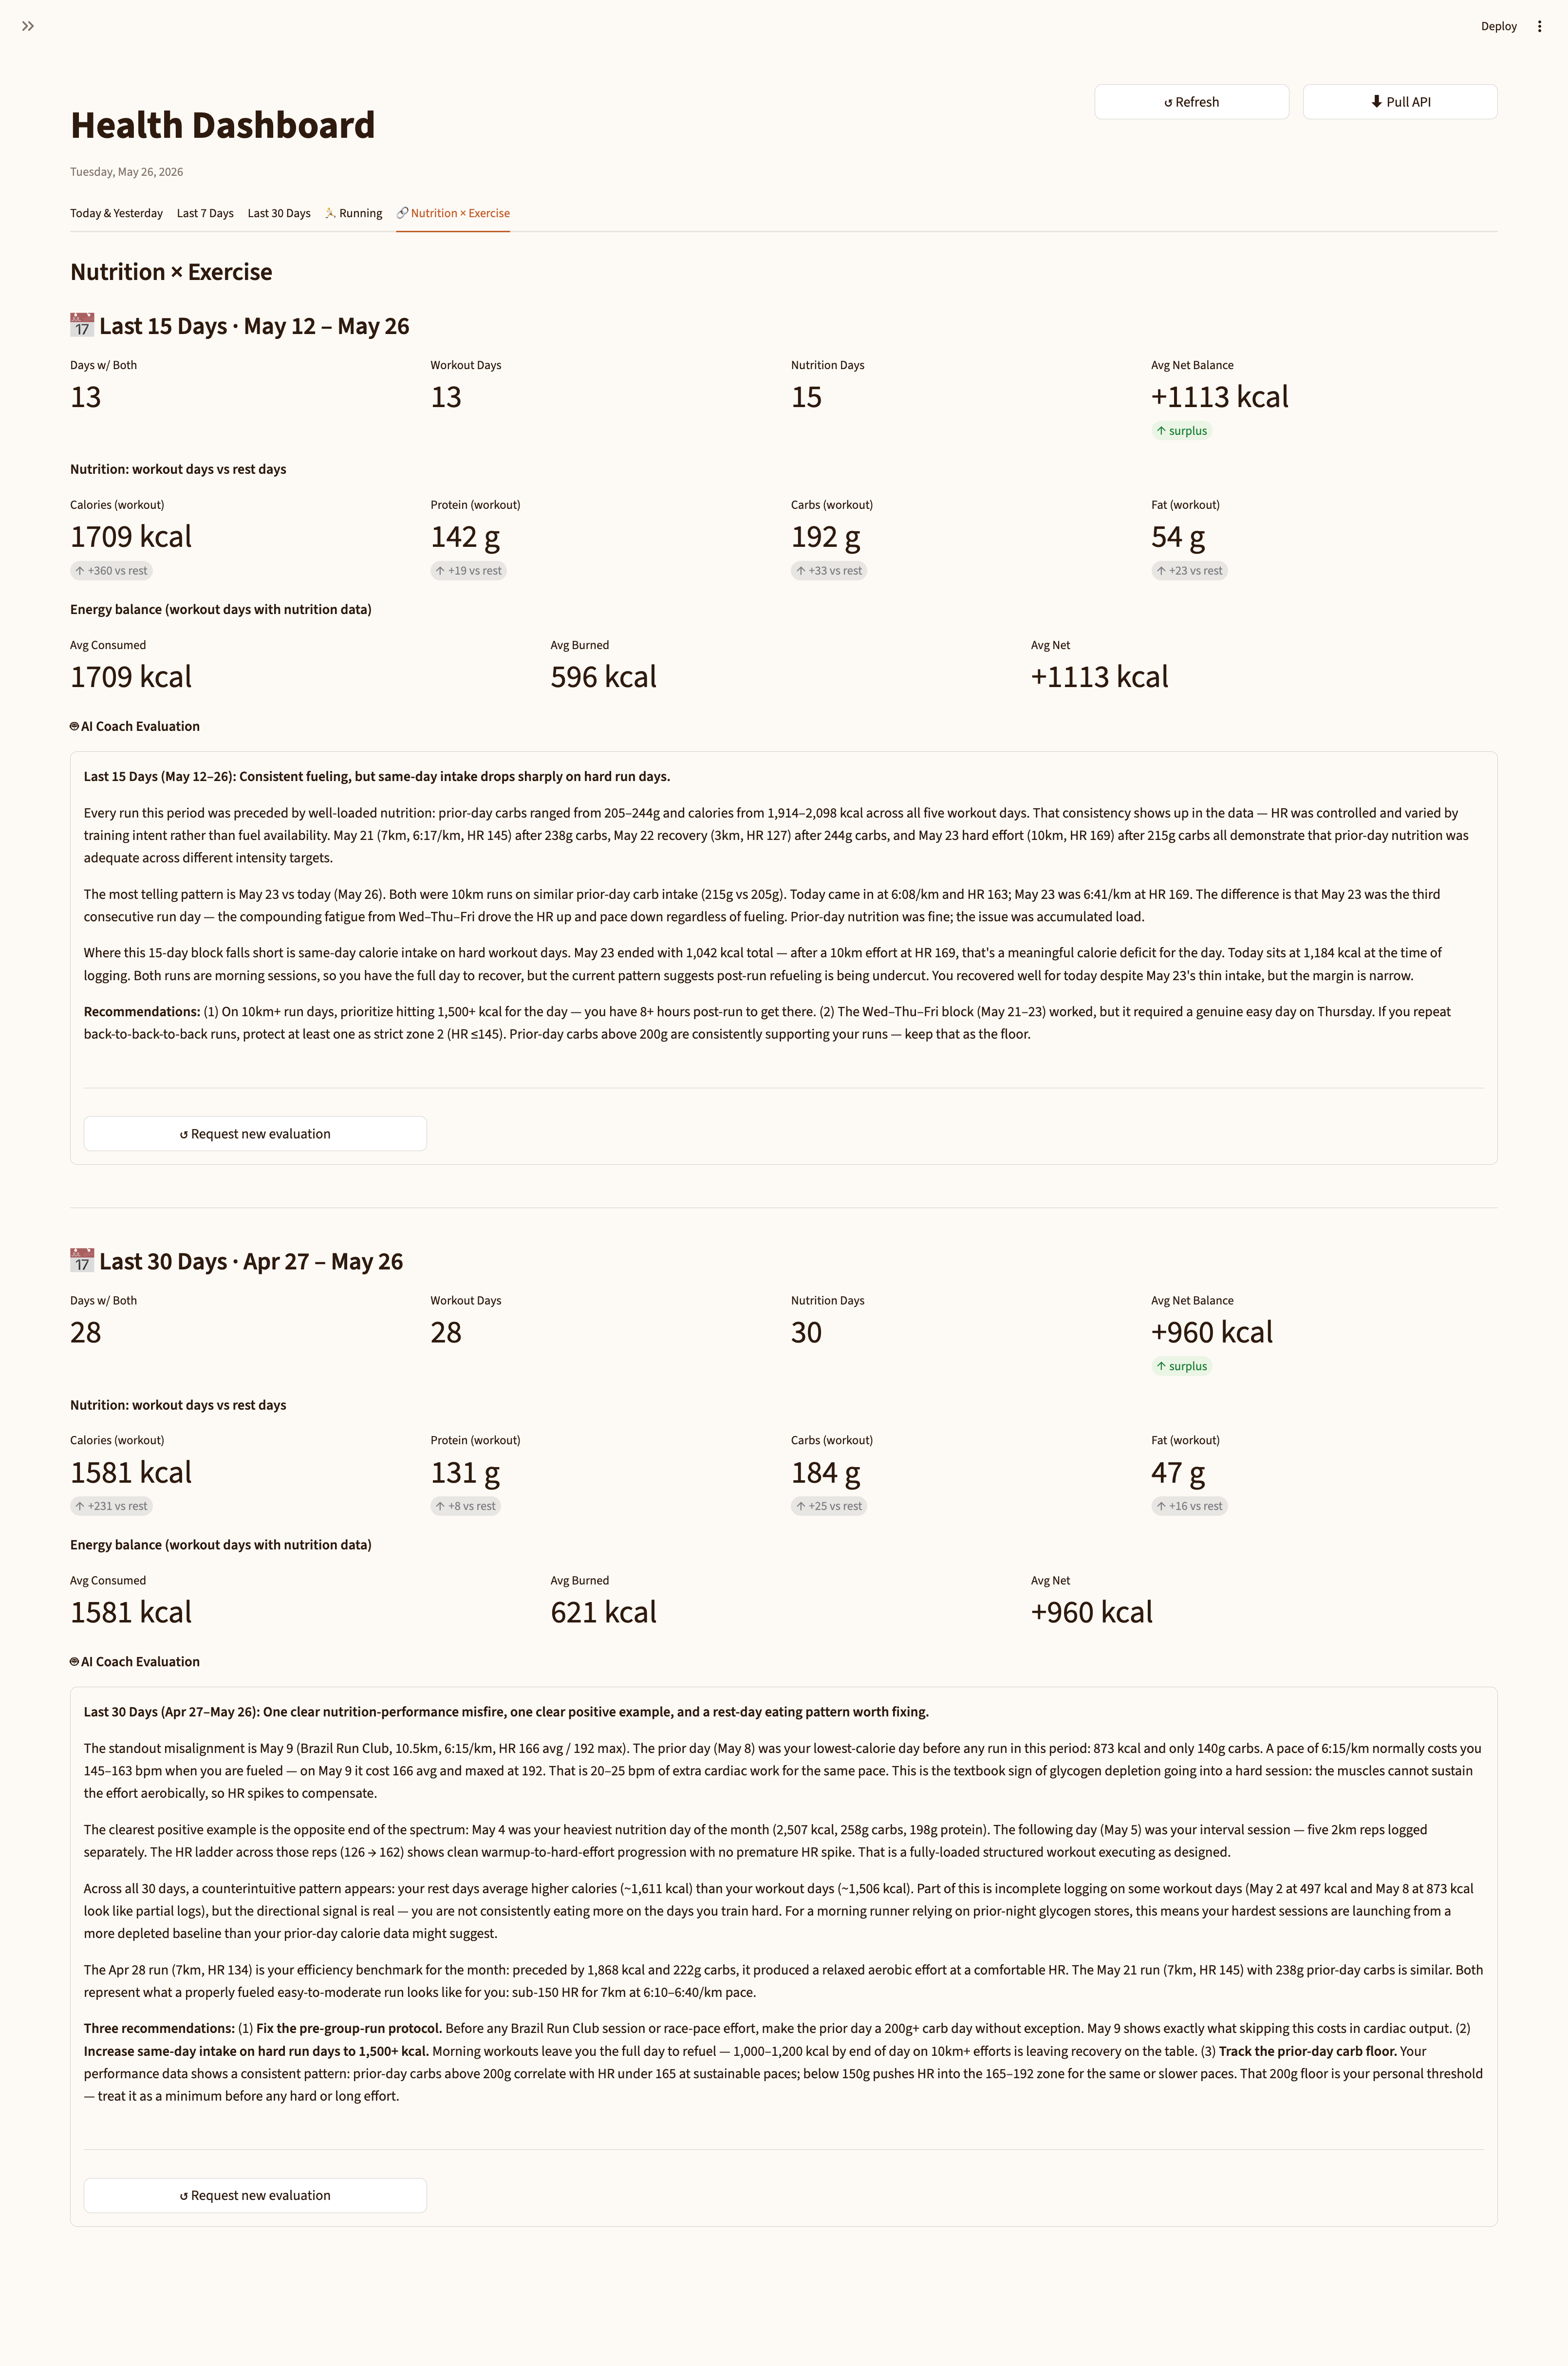 The Nutrition × Exercise tab: 15-day section showing workout day vs rest day averages, energy balance, and the AI coaching evaluation with specific date references.
What actually shows up in the evaluation
The evaluation is useful when the data has structure. A typical output for a consistent training week:
Prior-day carbs above 180g corresponded with the three fastest runs in the window (May 14, May 19, May 23), all finishing at or below 6:05/km despite comparable HR. On May 17 and May 21, prior-day carbs were 110g and 92g respectively — both runs showed HR 8-10 bpm higher at similar paces. The correlation isn’t perfect but the direction is consistent enough to treat 150g+ as a floor on hard training days.
When the data is noisy (inconsistent logging, variable workouts, few paired days), the evaluation says so directly. It’s specific to the numbers, not generic advice.
What’s still missing
Weight trend. MFP measurements (body weight over time) would complete the picture — you’d see nutrition, training load, and what the scale is doing in one place. The measurements endpoint works; it just isn’t wired into the dashboard yet.
Workout type differentiation. The correlation view currently treats all Strava activities equally. A lifting session has a different relationship with nutrition than a 15K run. Separating by sport type would sharpen the analysis.
Longer windows. 30 days is the current ceiling because the underlying data fetch is bounded there. For runners building toward a longer event, a 60 or 90-day view would be more useful for spotting slow-moving trends.
All of these are incremental additions to infrastructure that already works. The core loop — did what I ate yesterday affect how I ran today — is answerable now.
The full dashboard as of this post: five tabs, both data sources, AI coaching evaluations on running and nutrition-exercise correlation, all running locally with no cloud dependencies beyond the original Strava and MFP accounts. Part 4 covers the evaluation architecture in detail if you want to understand how claude -p becomes cached coaching text.