Health Dashboard Part 3: A Dedicated Running Tab
Overview
Part 2 ended with a working dashboard: Strava activities, MFP nutrition, calorie balance, three tabs. The general tabs do their job. But running is the sport I track most deliberately, and the general view doesn’t serve it well.
You can’t see how pace is trending over three weeks from a flat activity list. You can’t tell whether last Thursday’s easy run was genuinely easy (was HR actually low?) or just slow. You can’t see weekly volume without counting manually. The general tab mixes runs with lifting sessions and walks — useful for a total load picture, not useful for understanding your running specifically.
Running wanted its own tab.
Three windows
The Running tab is three time windows stacked vertically: 7 days, 15 days, 30 days.
Three windows sounds like overkill until you think about what each one actually answers.
7 days is operational. What did this week look like? How many runs, was the recovery day actually easy, does tomorrow need to be light or hard? This is the window for weekly planning.
15 days is the window most running apps ignore. It captures two full weeks of consistency — whether the pattern held through a rough midweek or a short trip. A single missed day barely shows at the weekly level; at 15 days you start seeing whether the structure is holding.
30 days is directional. Where is volume heading? Is average pace improving? Are you building toward something or just maintaining? This is the window for evaluating whether the training is actually going somewhere.
Each window shows the same set of aggregate metrics across three rows:
Runs | Total Distance | Avg Distance | Longest Run | Total Time
Avg Pace | Best Pace | Total Elev Gain | Avg Elev/Run | Unique Days
Avg HR | Max HR | Total Calories | Avg Calories | Suffer/PRs
That’s 15 metrics. Most running apps surface four of them.
The 7-day individual cards
The 7-day section goes one level deeper: each run gets an expandable card.
The card header shows name, date, distance, and pace — enough to identify the run at a glance. Expanding it reveals the full picture:
Distance    | Moving Time  | Pace         | Avg Speed
Avg HR      | Max HR       | Elapsed Time | Max Speed
Elev Gain   | Calories     | Suffer Score | PRs / Achievements
And below that, per-kilometer splits:
KM   DIST      PACE       TIME    HR        ELEV
1    1.00 km   6:05 /km   6:05    158 bpm   +0 m
2    1.00 km   6:11 /km   6:11    163 bpm   +0 m
3    1.00 km   6:08 /km   6:08    165 bpm   +0 m
...
If cadence or perceived exertion data is present, it shows up as an extra row. If power (Stryd, etc.) is recorded, that appears too.
The splits are the part I actually use most. A 10K at 6:08/km average tells you very little. A 10K that goes 5:55, 5:58, 6:00, 6:10, 6:22, 6:35, 6:40, 6:45 tells you it started too hot and faded. A 10K that goes 6:20, 6:18, 6:15, 6:10, 6:05, 6:00 is a negative split. Same average pace, opposite story.
What the data actually shows
Pulling up the last 30 days: 17 activities across 13 unique running days, 88.6 km total. Average pace 6:30/km, best sustained pace 6:08/km on today’s 10K.
The May 5 block shows up as five separate 2km activities — an interval session split into individual Strava entries. Looking at the per-entry HR (126 → 162 → 155 → 153 → 162) confirms the structure: warmup, then four hard intervals.
The 15-day view surfaces a 10-day gap between May 9 and May 19 that the weekly view misses entirely. The bounce-back quality (easy re-entry on May 19 at HR 123, volume building quickly) suggests the gap was managed well. But the gap is there, and the 15-day window is what makes it visible.
This is the whole point of having three windows. A 7-day view tells you what’s happening right now. A 30-day view smooths over everything. The 15-day view is where the story actually lives.
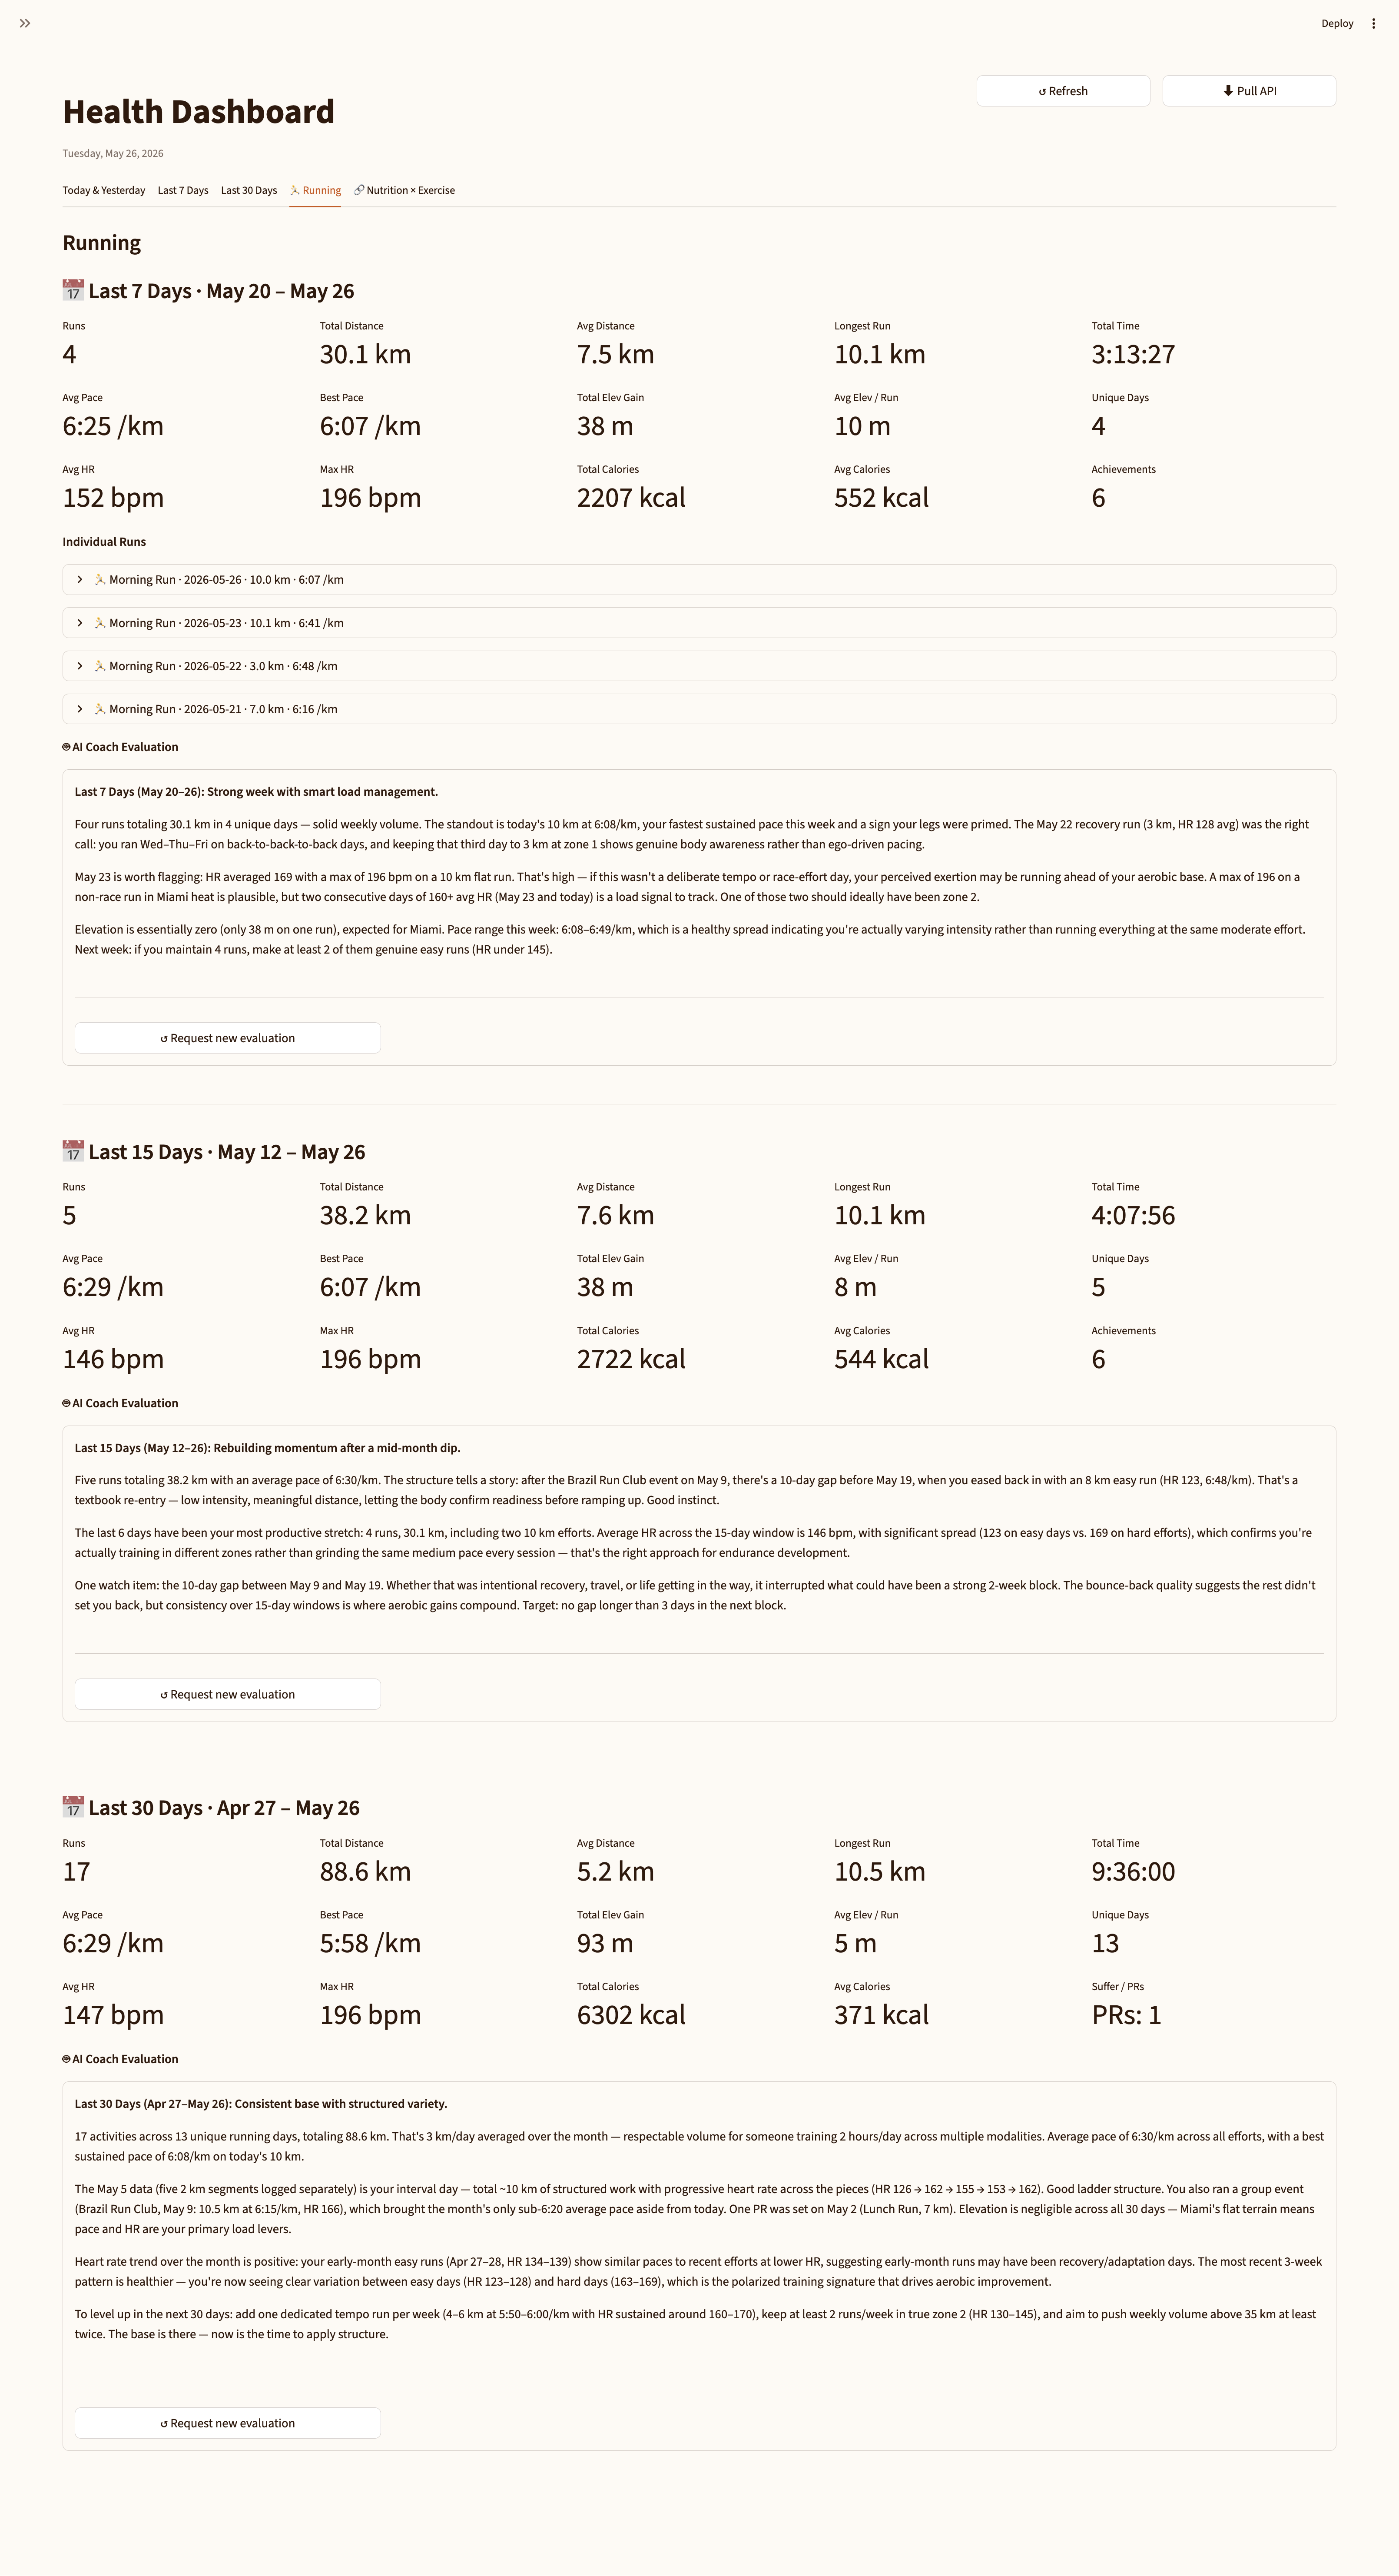 The Running tab: 7-day section with expandable per-run cards (showing per-km splits below), followed by the AI coaching evaluation for the period.
The fetch pattern
The running tab doesn’t make extra API calls. It filters from all_month — the 30-day activity list already fetched for the main tabs — using a date slice:
def runs_in_window(all_activities: list[dict], start: date) -> list[dict]:
    start_str = start.isoformat()
    return [
        a for a in all_activities
        if a.get("sport_type") == "Run"
        and a.get("start_date_local", "")[:10] >= start_str
    ]
The 7d and 15d lists are subsets of 30d. One API budget, three windows.
Per-kilometer splits require the detailed activity endpoint (/activities/{id}) — the summary list only includes aggregate stats, not splits_metric. These calls are already made when enriching calories, and the responses are cached at 15 days. Opening a run card is a SQLite read, not an API call.
What’s still missing
Pace trend chart. Seven days of average pace plotted over time would make the trajectory visible at a glance. A flat activity list can obscure whether things are improving or holding steady.
HR zone breakdown. Time in zone 1/2/3 per run would let you answer “was that run actually aerobic or did it creep into threshold?” at a glance. Right now you get average HR, which is a blunt instrument.
Both of these need the streams endpoint — raw GPS/HR time-series per activity, /activities/{id}/streams — which isn’t in the current strava-mcp build. When that lands, the individual run cards get a lot more interesting.
For now, the tab tells you what most training platforms don’t: the full picture of every run, across the three time windows that actually matter for making training decisions.
The coaching analysis on top of all this — where Claude reads the data and writes an evaluation — is in Part 4.